Bloomsbury Associates


Bloomsbury blog Can I afford to retire? And what if retirement looks tight?
Bloomsbury blog post, 16 August 2026
People always want to know whether they can afford to stop working and what their financial situation will look like throughout retirement.
And the answer is dependent on a range of factors - like when you want to retire, how much you want to spend, your investment risk, and whether you qualify for superannuation or other transfers. Without knowing these factors, it's impossible to create a personalised plan.
How will households know when they have enough saved for retirement? What can they do if they don't have enough yet?
Here's an example of how we can work that out.
A retirement plan for the average household
We want to be clear - this analysis is indicative and educational. It is not financial advice and does not account for your personal circumstances.
Meet David and Susan Smith:
- David and Susan are both 65 years old.
- They want to create a financial plan to age 90.
- They are going to hold their retirement savings in a 'balanced' investment portfolio, with 60% growth assets and 40% income assets.
- Their marginal income tax rate is 17.5% and their prescribed investor rate is 17.5%.
- They plan to spend the average household expenditure throughout retirement.
- This spending will be offset by New Zealand superannuation.
The latest figures for average household expenditure come from Statistics New Zealand's 2023 Household Economic Survey. The average household spent $1,636 per week or $85,000 per year. In larger cities, that figure was higher - for example in Wellington, average household spending was $97,000 per year.
So how much would David and Susan need saved for this retirement plan to succeed?
Retirement savings for the average household
We ran this scenario using our financial planning software. We don't need to get too deep in the weeds with how we created these financial projections, but in short, we simulated thousands of potential future paths for the scenario assumptions we outlined above.
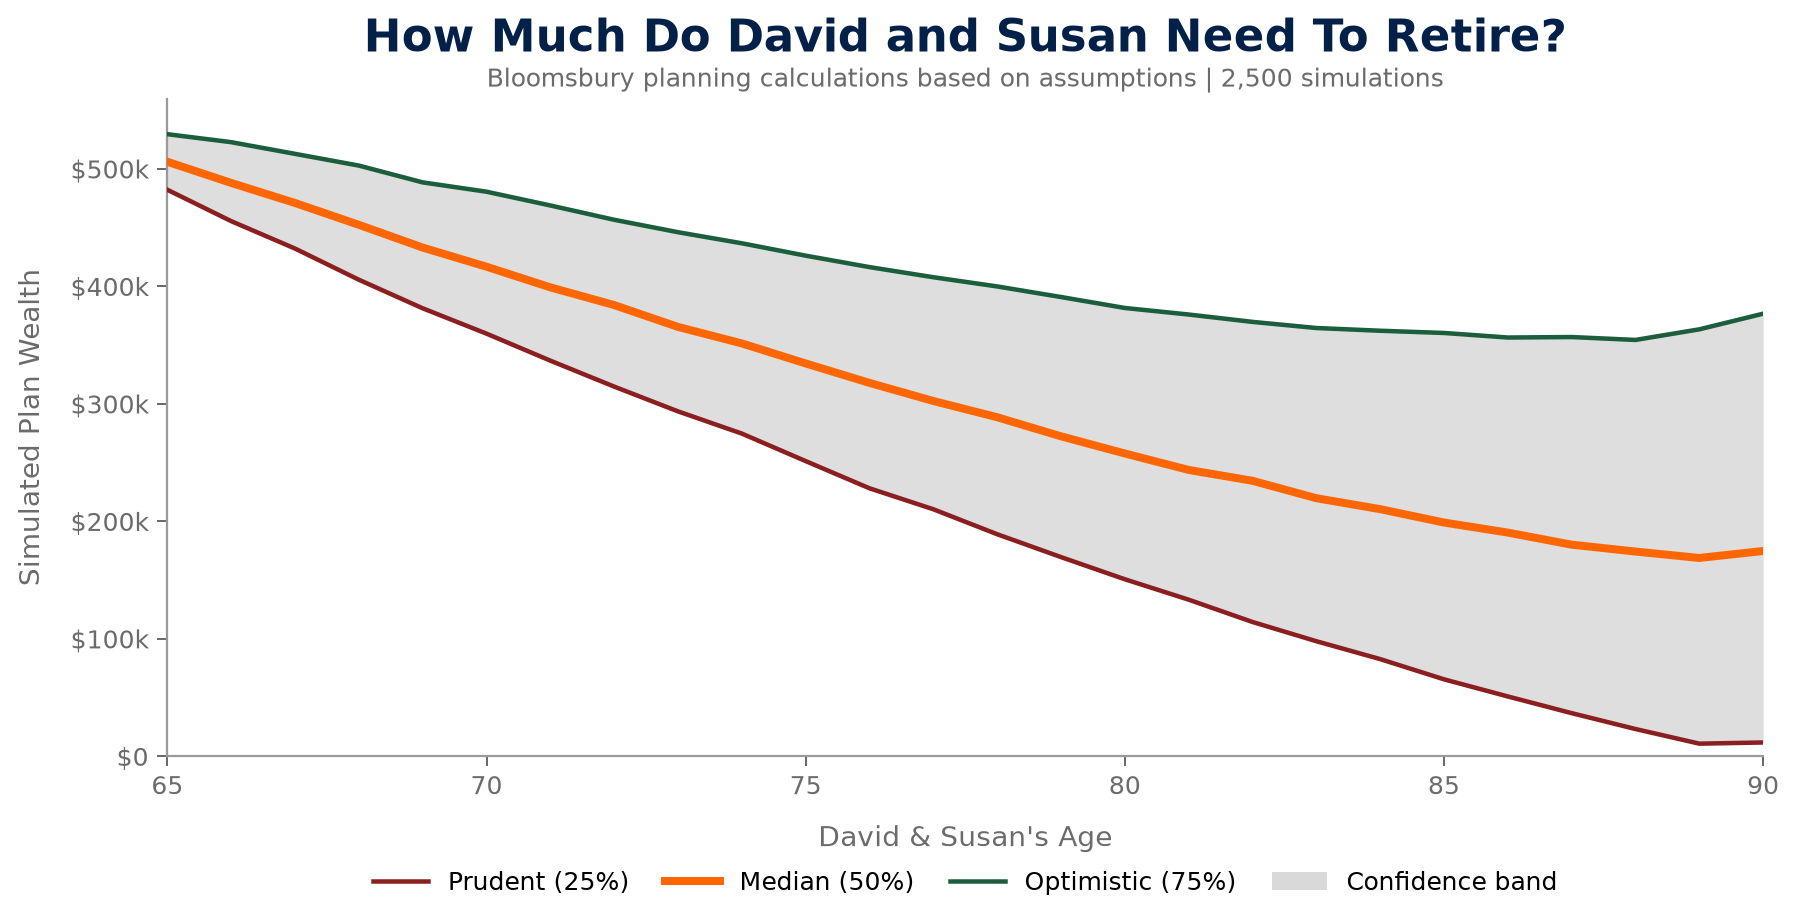
To draw an after-tax retirement income of $85,000 per year, David and Susan need to have approximately $523,000 saved for retirement between them. The chart below shows their expected wealth if they retired at 65 with $523,000 and models it to age 90, with a 50% confidence interval covering a range of market outcomes.
If David and Susan were living in a large city and planned for a retirement income of $97,000 per year, they would have needed to save $735,000 for retirement. But, now we know the savings balance required, what happens if David and Susan don't have it?
What if they don't have enough saved? The power of a flexible plan
Say David and Susan only have $400,000 in retirement savings, $123,000 short of the required amount. How can they make their retirement plan work? A good retirement plan always has built-in flexibility levers. We pull one or more of these levers and adjust the plan to ensure success.
Flexibility levers, like an element of any plan, need to be tailored to an individual. David and Susan's levers may be completely different to yours. Which lever you'd pull first also depends on your situation and priorities.
Without making any adjustments, when starting with $400,000 saved, David and Susan's plan only has a 9% chance of success.
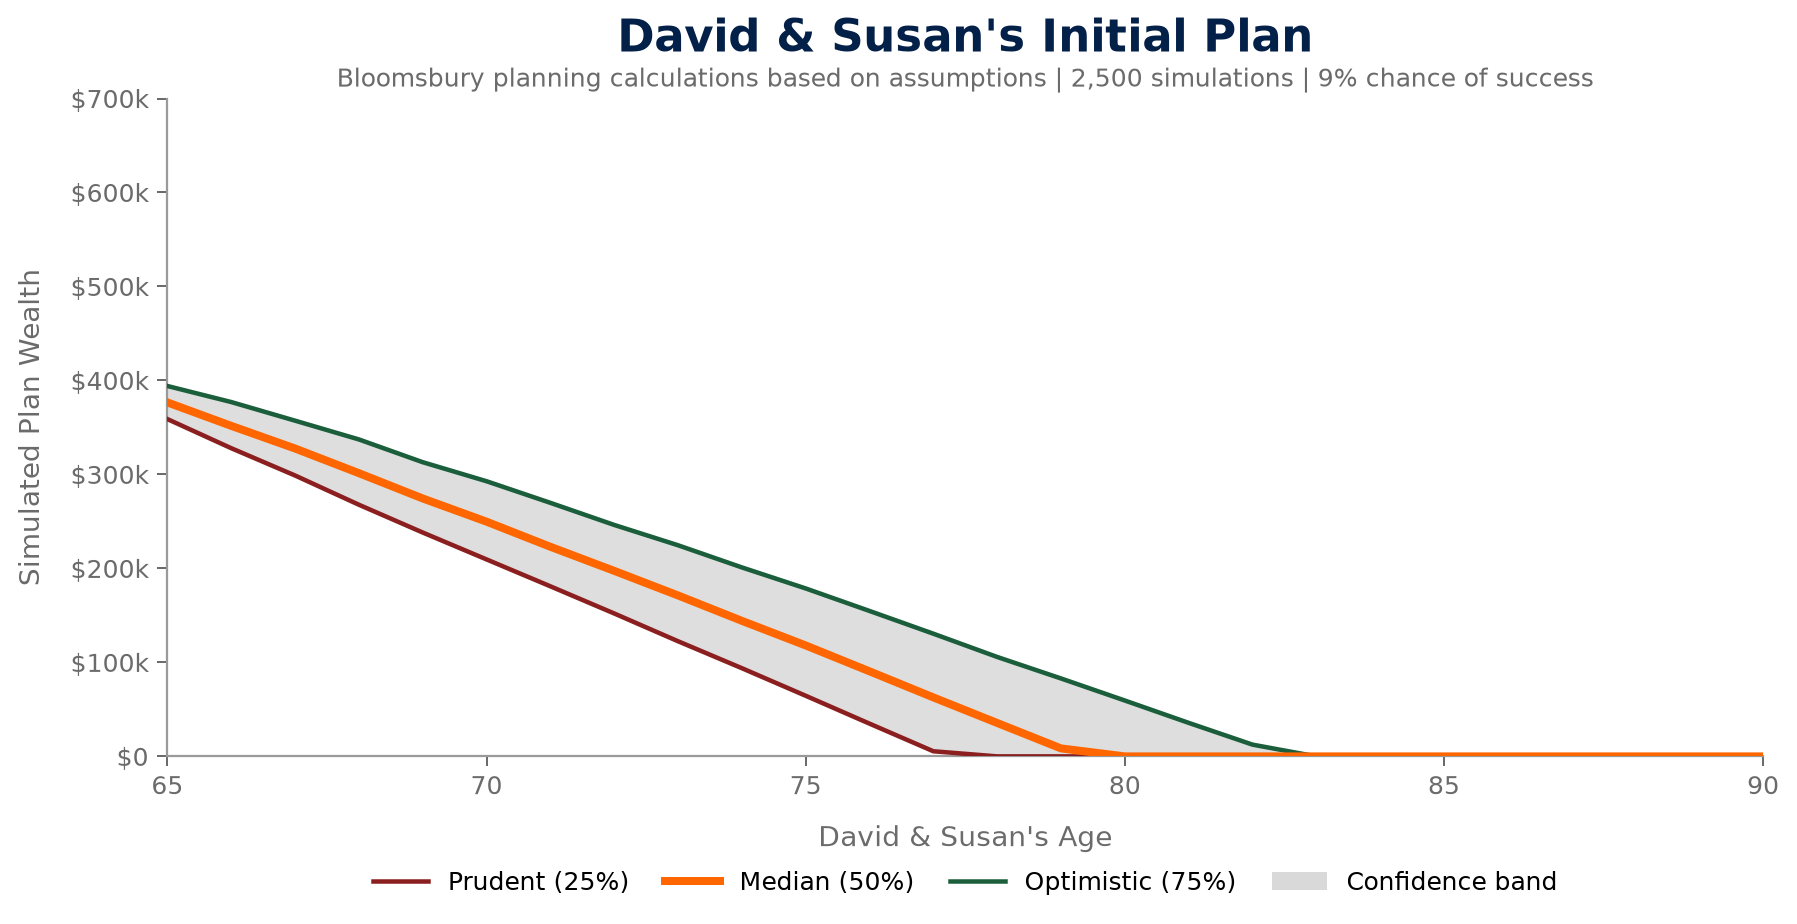
In this situation, we want to the plan to have at least a 75% chance of success. To increase their plan's chances, we could adjust their investment risk, retirement age, and planned retirement spending.
(1) Investment risk
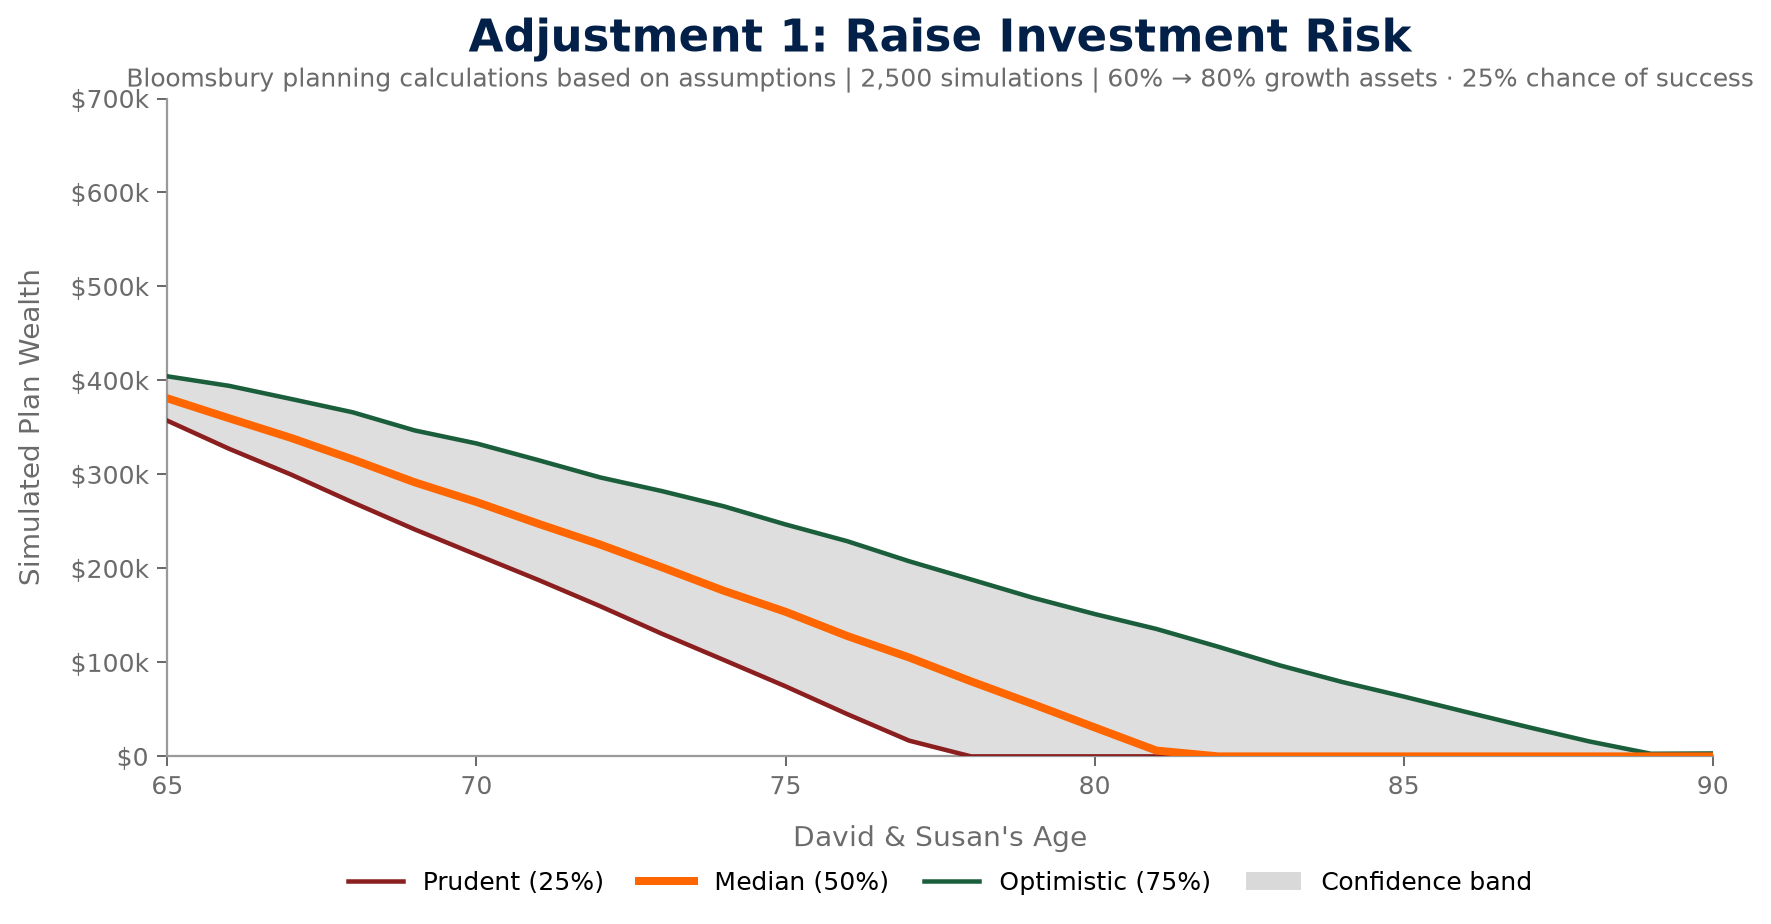
Instead of an investment portfolio targeting 60% growth assets, we target 80% growth assets. This increases the long-term expected returns and improves the plan's chance of succeeding to 25%.
(2) Retirement age
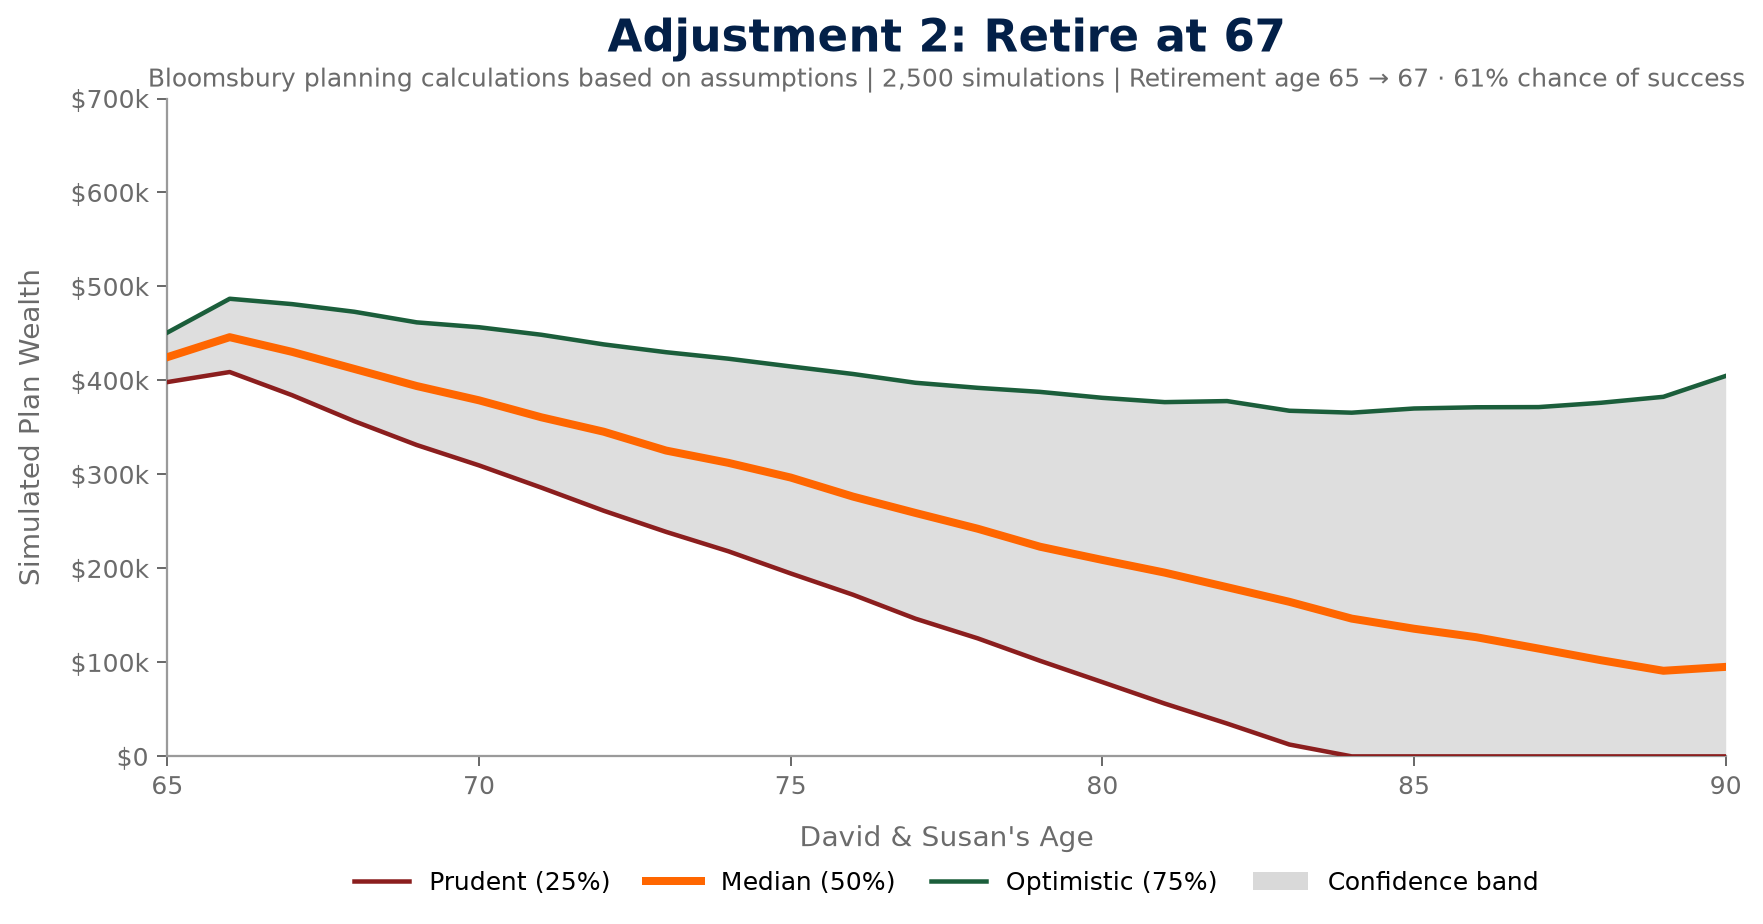
Instead of retiring at 65, David and Susan could hold off on starting withdrawals from their retirement savings until age 67. Again, this improves the plan's chance of success (to 61%) - but it's not quite there yet.
(3) Retirement spending
We could reduce David and Susan's planned annual spending in retirement by $3,000, to $82,000 per year. This brings our plan's chances of success up to 77%.
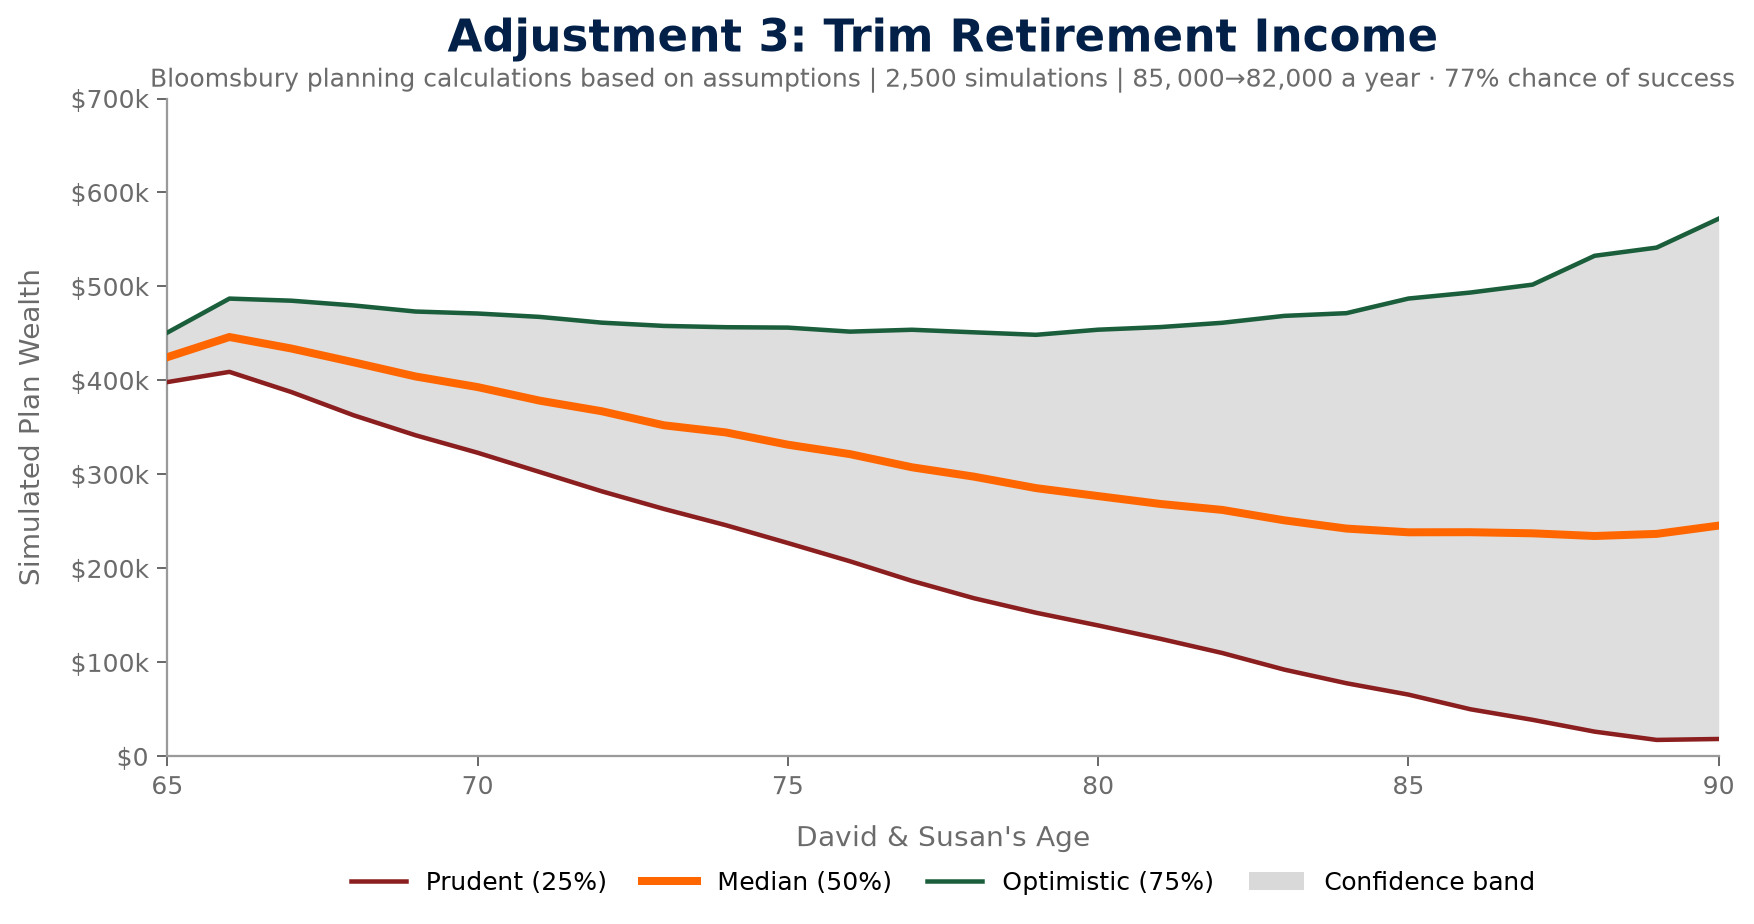
Now, we have a plan that's back on track.
What's my number?
This is not personalised analysis. What you need to have saved for retirement will differ based on your retirement age, your investment risk, your spending goals, tax rates, and countless other factors.
You might also have different goals. In this analysis, we've calculated what level of retirement savings are required to meet the other goals of the plan - like retirement at 65 or spending of $85,000 per year. However, some plans target completely different goals - for example, the question might not be “What's my number?” but “When can I retire?” - which prompts a completely different approach.
Nevertheless, we hope our approach to this problem highlights that a retirement plan isn't set in stone. A range of flexible levers is the key to a successful plan that delivers on your financial goals. As your circumstances, values, and goals change over time, these levers, and your plan, should change with you.
If you're interested in a tailored plan to explore your options in retirement, please contact our advice team.