Bloomsbury Associates

Bloomsbury Autumn Update 2026 January - March 2026
In this issue
- Market commentary
- Key market movements for the quarter
- The case for a strategic allocation to New Zealand shares
- Gillies McIndoe Research Institute
- Aotearoa New Zealand Festival of the Arts
- Like what you've read?
- Disclaimer
Market commentary
While the last several years have seen many international share markets delivering strong double-digit investment returns, the first three months of 2026 saw most markets taking a small step backwards.
Market declines can happen at any time, but the primary headwind this quarter was linked to the escalating conflict in the Middle East. US and Israeli missile strikes on Iran disrupted the flow of oil through the Strait of Hormuz and created uncertainty for the global economy. Following the initial strikes, oil prices quickly surged from around USD 70 per barrel to above USD 100 per barrel. This eroded investor confidence in future corporate profits and led to increased risk aversion from investors, both of which contributed to lower share prices.
Throughout March, investor sentiment oscillated between fears of a prolonged military conflict and hopes for de-escalation.
Bond markets were similarly affected, particularly in March when most government bond prices fell (ie bond yields increased). The likelihood of materially higher oil prices passing through into higher inflation quickly led the market to begin pricing in interest rate increases, even in some countries where interest rate cuts were previously anticipated.
With conflicting reports about the status of negotiations between Iran and the US, it has been difficult to guess when hostilities might ease and when markets will begin to look beyond the immediate uncertainty. However, if history is any guide, markets are adept at doing exactly that and we can expect them to eventually begin pricing in a recovery even before events in Iran can be considered anywhere near back to normal.
This concept was reinforced overnight on 8 April, with the announcement of a two-week ceasefire and a reopening of the Strait of Hormuz. Whether or not the ceasefire ultimately holds, global share markets responded immediately with a strong rebound.

Geopolitical risks elevated but not unprecedented
In our lifetimes, we are (at least from a New Zealand perspective) more accustomed to peace and relative geopolitical stability being the status quo. That's why when a significant event like the recent attack on Iran occurs, it feels like the world is suddenly much more unstable.
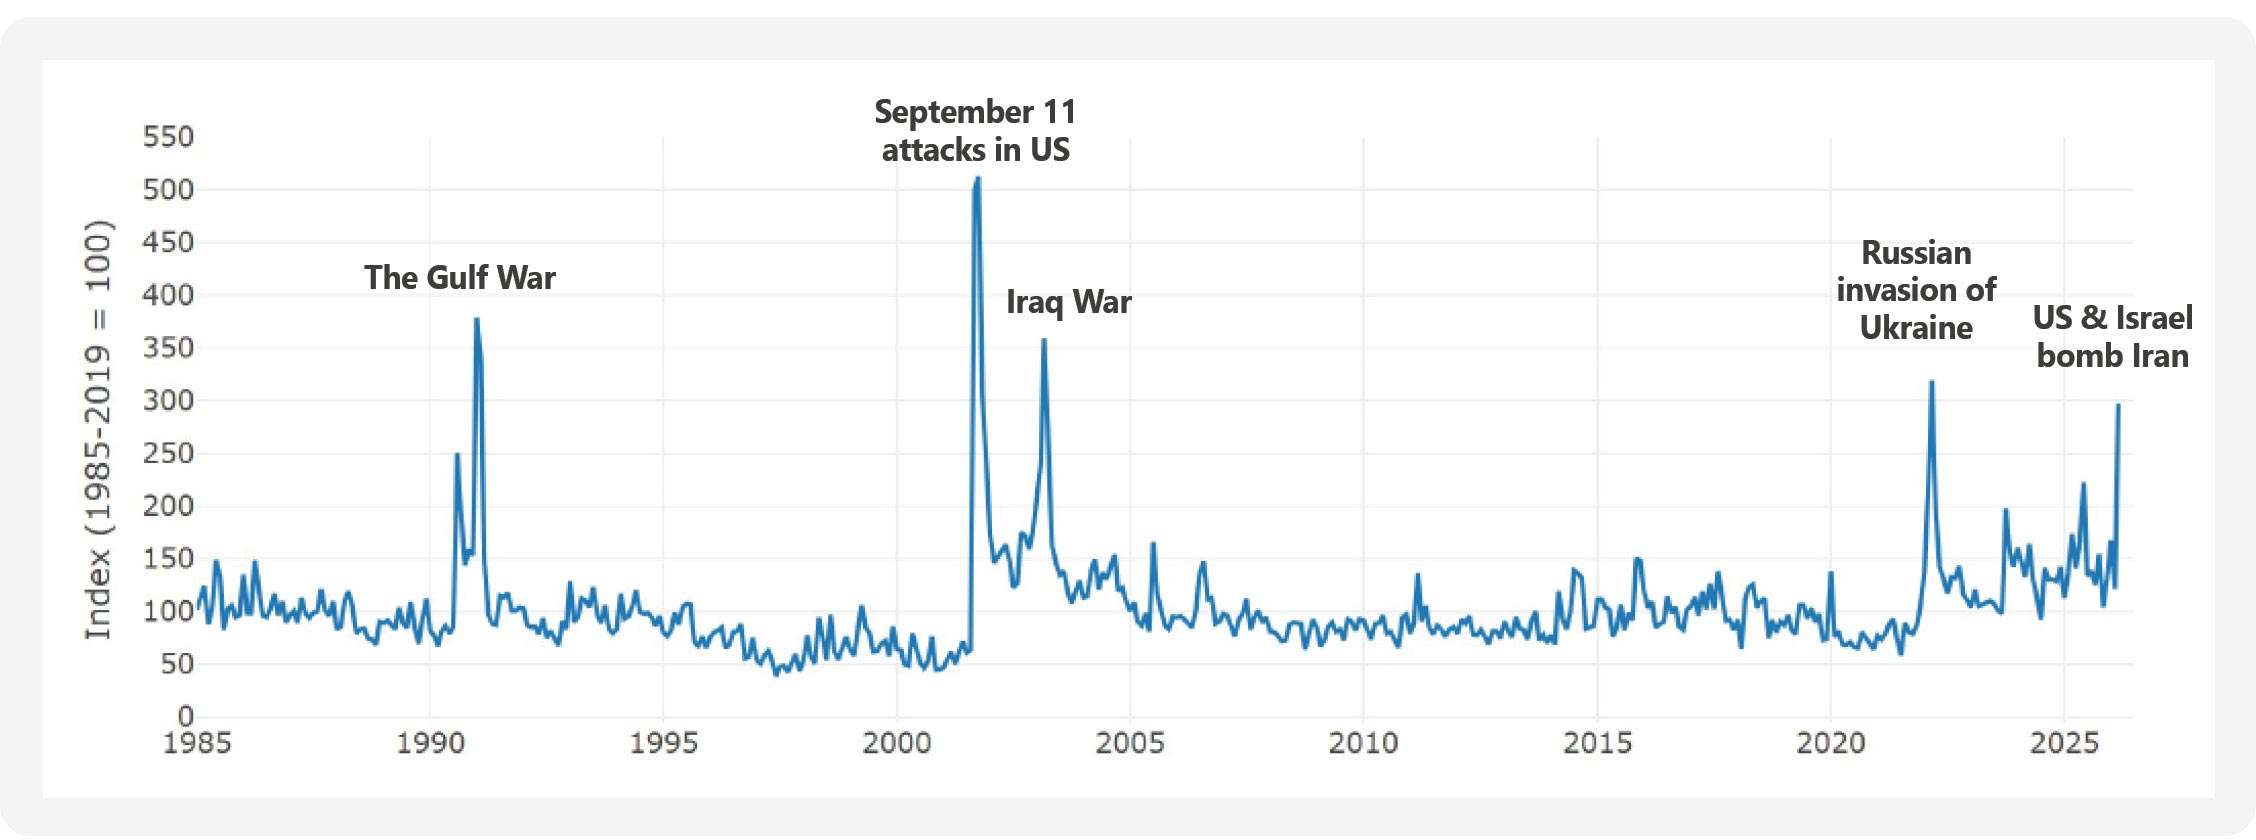
While all major geopolitical events are uniquely different, Dario Caldara and Matteo Iacoviello (directors in the International Finance Division of the Board of Governors of the Federal Reserve in the US) developed a mechanism to enable us to compare different geopolitical risks over time. They created a Geopolitical Risk Index (GPR Index) which aggregates the occurrence of words and phrases related to geopolitical tensions that are published in leading international newspapers. This data is converted into an index number, updated monthly.
Since the mid 1980s, the GPR Index has recorded five distinct spikes, as per the following chart:
Spikes in the GPR Index since the mid 1980s
See larger version of this image
Source: Caldara, Dario and Matteo Iacoviello (2022), Measuring Geopolitical Risk, American Economic Review, April, 112(4), pp.1194-1225. Data downloaded from Geopolitical Risk (GPR) Index on April 6, 2026.
The index seems to do a very good job of confirming periods of escalating geopolitical instability but, as a real-time indicator, it doesn't provide any insight into how these elevated risks might impact investment markets.
However, for that information, we can simply look back in time and calculate exactly how major markets performed from the moment those geopolitical risks first spiked. When we do this, we see the following results (based on the returns of the S&P 500 Index in the US):
Subsequent returns of the S&P 500 index
| Geopolitical event | Next 1 year | Next 3 years (per year) |
|---|---|---|
| Gulf War | 22.7% | 15.3% |
| September 11 attacks | -15.1% | 3.9% |
| Iraq War | 35.1% | 17.2% |
| Russia invades Ukraine | -7.7% | 9.1% |
| Average return | 8.8% | 11.4% |
Source: S&P Dow Jones Indices LLC, Consilium calculations
While we don't have any data (yet) for the current conflict in the Middle East, the four earlier spikes on the GPR Index show average returns for the S&P 500 Index over the subsequent 12-month and three-year periods of 8.8% and 11.4% p.a. respectively. Although this is a small sample, these are, by any measure, good returns.
Without a crystal ball to tell us how the immediate future plays out, past events reveal that even when geopolitical risks are abnormally large, we can, on average, expect investment markets to continue to deliver very good long-term returns.
1970s revisited?
The recent surge in oil prices has drawn comparisons with the oil shock of the early 1970s. While there are some similarities in the geopolitical triggers and inflationary implications, the scale and market impact look to be quite different.
The 1973-74 period was characterised by a severe and sustained supply shock following the OPEC oil embargo when Arab member states stopped exporting oil to nations supporting Israel. This caused the oil price to rise from around USD 3 per barrel to over USD 11 per barrel in a matter of months, an increase of roughly 300-400%. This sharp rise fed directly into inflation, contributing to a period of stagflation across developed economies.
To use a sporting analogy, stagflation is a real coach-killer. It is an economic malaise typified by low growth, high unemployment (ie stagnation) and increases in consumer prices (ie inflation) and it's an environment that investment markets usually detest. This was indeed the reaction in the early 1970s as the S&P 500 Index declined approximately -15% in 1973 and a further -26% in 1974, resulting in a two-year market decline of almost -40%. The combination of surging inflation, tightening monetary policy, and recessionary conditions created a deep and prolonged bear market.
In contrast, the oil price shock related to this year's events has been much less severe. Oil prices rose from around USD 70 per barrel (pre conflict), to around USD 120 per barrel in early March, and have eased to about USD 90-100 per barrel at the time of writing (early April). In other words, we've witnessed a 'peak' price spike of around 70% and a 'current' price increase, while ceasefire discussions are developing, of around 35% versus early 2026 prices. Although painful, this is a far cry from the 300-400% price increase experienced in the 1970s.
The share market impact has, so far, also been much less severe. Since the commencement of hostilities on 28 February, the S&P 500 Index declined by -7.8% until 30 March. However, on that date the first suggestions of ceasefire talks began to emerge and the index rebounded by +2.9% the next day and has recovered by +7.5% to 10 April, rapidly approaching the prior share market peak.
These adjustments, in both oil prices and share market valuations, are more reflective of a cyclical shock than the prolonged structural shift experienced in the 1970s. Assuming an enduring ceasefire eventually takes hold and safe passage through the Strait of Hormuz returns, the current upheaval is very unlikely to have a protracted 1970s-style impact on economies or markets.
AI remains a key theme
Artificial intelligence (AI) remained a topical long-term investment theme over the quarter, with further evidence of its broad economic impact continuing to emerge.
In particular, the news related to AI developments was characterised by two main themes:
- The significant ongoing capital expenditure by major technology firms into AI infrastructure
- The expansion of AI applications into business software, healthcare and industrial processes
While AI-related shares had already delivered strong returns in prior periods, the narrative evolved during the recent quarter. Investors began to focus less on general AI hype and much more on the pathway to monetisation of the significant sums being invested in AI, and on tangible productivity gains available to underlying users of the technology.
What resulted was a more nuanced shift in the market. Rather than hype leading to the majority of AI companies rising or falling together, the quarter was notable for a more differentiated market response related to the specifics of underlying businesses.
In simple terms, companies that could demonstrate clear earnings benefits from AI were rewarded, while those with less obvious pathways to profitability saw more muted performance.
For long-term investors, AI remains a structural growth driver. The first quarter price action simply reinforced the importance of valuation discipline, as AI-related businesses, priced more on fundamentals such as profitability, tended to outperform.
Tariff update
In yet another twist in the ongoing tariff saga, on 20 February the US Supreme Court ruled that the US administration's imposition of 'reciprocal' tariffs in 2025 under the International Emergency Powers Act was unlawful.
President Trump responded swiftly to this setback, imposing a 10% global tariff on all imports for up to 150 days under separate Trade Act legislation.
The Supreme Court's ruling raised considerable uncertainty over the fate of the tariff revenue already collected, and more than 1,000 companies have now filed lawsuits in the US Court of International Trade to secure their share of the estimated USD 166 billion in illegal collections.
President Trump is scheduled to travel to Beijing in May, with the Supreme Court ruling likely to have strengthened China's negotiating hand ahead of those talks.
New Zealand Inc
Closer to home, the Reserve Bank of New Zealand (RBNZ) left the Official Cash Rate unchanged at 2.25% on 18 February, reminding markets that the economic recovery is at an early stage and that stimulatory policy is likely to be required for some time.
It also noted that the recent increase in annual inflation to 3.1% was heavily influenced by increases in 'administered' prices that monetary policy has very little impact on (ie electricity costs, council rates etc). Outside of these, components of the non-tradables basket that are generally more sensitive to monetary policy changes were already considered to be close to average or acceptable levels.
Post the February announcement, the Iran war has led to a worsening in New Zealand's inflation outlook and the RBNZ is currently forecasting a temporary spike in headline inflation to 4.2% in the second quarter. The largest contributor to this is higher energy and transport costs resulting from the disruption to oil supplies.
At the moment, the RBNZ's strategy is to 'look through' this temporary spike in inflation, until greater certainty around the conflict in the Middle East and the potential impact on long-term oil supplies and prices is clearer.
If the positive trajectory of peace talks is maintained and oil market pressures continue to ease, the more likely scenario for New Zealand is that the economic recovery that was previously thought to be underway in the first quarter of 2026, will be delayed until later this year or early 2027.
Zoom out, not in
While certainty about the future would make our lives a lot easier, that's not the reality of the world we live in. Six weeks ago, oil was at USD 70 per barrel. The next day the US and Israel started bombing Iran and the Strait of Hormuz closed. We didn't get the memo ahead of time, but then again, we never do.
Now there's a ceasefire being negotiated and what happens to oil prices will be directly related to what occurs in those talks. The uncertainty attached to all of this has seen markets move up and down in large increments. It's unsettling on many levels, so how can investors cope in such a volatile environment?
One answer is to zoom out, not in.
When we zoom in, we tend to be hyper-focused on the current situation, the latest news and the most recent market movements. It's a debilitating way to view your portfolio because a bad day or a bad week feels like a bad year in your head. A volatile month starts to feel like the new normal.
It isn't. And to confirm it isn't, all you need to do is zoom out. Don't focus on the last day or week or month, look instead at the last year, or two or three. If you can, look at your entire long-term investment experience.
For many investors, a longer horizon will contain periods of even worse news and volatility than portfolios are facing right now. They persisted through those periods and subsequently thrived. They will survive this one too.
Being strategically invested in a well-diversified, low-cost investment portfolio is the very best way to ensure that when markets do endure, and subsequently thrive, you are ideally positioned to capture the gains that will inevitably be delivered in the future.

Key market movements for the quarter
March 2026
The first quarter of 2026 proved broadly challenging for investors, as a convergence of geopolitical, inflationary, and policy risks generated significant volatility across multiple asset classes.
The defining development of the period was a sharp escalation in geopolitical tensions, with the outbreak of conflict in the Middle East inflicting considerable damage on regional energy infrastructure and effectively closing the Strait of Hormuz to commercial shipping. The resulting supply shock drove oil and gas prices sharply higher and rapidly redirected investor fears toward renewed inflation risk, displacing the economic growth concerns that had characterised much of late 2025.
Prior to this escalation, share markets had already faced headwinds from heightened scrutiny of the earnings announcements of mega-cap technology companies, and fresh uncertainty on trade policy, with the US administration implementing a flat 10% tariff on all imports following a Supreme Court ruling against its prior tariff framework.
Shares and bonds experienced broad price weakness as markets shifted their focus toward these developing geopolitical and inflation risks, resulting in value shares outperforming growth shares by a clear margin. Bond markets similarly endured a turbulent quarter as the prospect of renewed interest rate hikes across several major central banks displaced earlier expectations of continued policy easing.
International shares
Developed market shares declined over the quarter, with weakness concentrated in the US and continental Europe, while Japan and the UK offered some relative resilience.
In the US, large-cap technology companies came under pressure early in the quarter as investors grew increasingly sceptical about whether the scale of AI-related capital expenditure could generate sufficient future returns. US software shares fell sharply through late February, and while the technology sector demonstrated some relative stability in the immediate aftermath of the Middle East conflict, it still finished the quarter with material losses.
European shares struggled as rising natural gas prices reignited concerns about the region's growth trajectory. The European Central Bank held interest rates steady at its March meeting but adopted a notably more 'hawkish' posture, signalling that rate increases are a live possibility given the upward revision to its inflation projections.
The UK share market was a notable exception among European peers, delivering a positive return for the quarter. The commodity-heavy composition of the UK market proved advantageous, as energy and materials companies benefited from higher global prices, and a modestly weaker British Pound provided an additional tailwind for the large number of UK-listed companies with significant international revenue streams.
Japan's share market was the standout performer among major developed markets. Japanese Yen weakness provided a structural boost to export-oriented businesses, while the ruling Liberal Democratic Party's (LDP) decisive victory in the February snap election was interpreted by investors as supportive of continued fiscal stimulus for the domestic economy.
Source: MSCI World ex Australia Index (net div.)
Emerging markets shares
Emerging market shares ended the quarter near flat, outperforming developed markets. Early in the quarter, technology-driven markets in the region benefited from sustained investor enthusiasm for AI-related hardware and semiconductor companies such as the big players found in South Korea and Taiwan. This provided a meaningful offset to broader share market weakness, particularly for markets with significant exposure to the global technology supply chain.
The outbreak of conflict in the Middle East introduced a sharp new headwind as the quarter progressed. With a substantial share of globally traded oil and gas destined for Asia transiting the Strait of Hormuz, the disruption to that critical corridor raised immediate concerns about energy costs and supply security across the region. This contributed to a swift reduction in investor sentiment during the latter part of the quarter.
A stronger US dollar compounded the challenge, as dollar strength typically tightens financial conditions and weighs on capital flows to emerging economies. Despite these pressures, the breadth and geographic diversity of the emerging market universe allowed the asset class to absorb regional shocks more effectively than the concentrated losses experienced across developed markets.
Source: MSCI Emerging Markets Index (net div.)
New Zealand shares
In line with the global trend, the New Zealand share market delivered a negative return for the first quarter of 2026.
At the beginning of the year, early signs pointed to a broadening economic recovery, supported by continued easing from the Reserve Bank of New Zealand (RBNZ). While total returns to the end of February were modestly positive, the New Zealand market was unavoidably affected by the Middle East conflict in March.
However, not all company fortunes suffered in the face of the changing international landscape. Among the quarter's notable positive contributors, A2 Milk (ATM) advanced +7%, continuing its recovery trajectory underpinned by sustained milk powder demand from Asia. Infratil (IFT) also gained +5%, reflecting investor confidence in its diversified infrastructure and digital asset portfolio. The financials sector was another source of relative strength, with NZX-listed banks - including Westpac and ANZ - posting positive returns on the back of improving net interest margins.
On the other side of the ledger, the quarter produced several significant casualties. EBOS Group (-19%), Fletcher Building (-20%), and Mainfreight (-16%) all declined, each reflecting distinct but overlapping issues in relation to cost pressures and declining profitability. KMD Brands (KMD), the parent company of Kathmandu and Rip Curl, was the most dramatic underperformer in the quarter, with its share price declining almost -60%. The company undertook a heavily discounted capital raise, reflecting both the urgency of its balance sheet position and the sustained deterioration in profitability across its retail business.
Source: S&P/NZX 50 Index (Gross with Imputation)
Australian shares
Although the S&P/ASX 200 Index delivered -1.6% in Australian dollar terms over the quarter, it exhibited greater resilience than many of its global developed market peers. The principal driver behind this stronger relative return was Australia's substantial weighting in energy and materials companies - sectors that benefited directly from the sharp rise in commodity prices triggered by the Middle East supply disruption.
The Bloomberg Commodity Index advanced +24.4% for the quarter, with oil and gas prices surging sharply as the conflict curtailed regional supply and restricted passage through the Strait of Hormuz. Australian resource companies were well positioned to capture the associated earnings tailwind, and the commodity-heavy composition of the S&P/ASX 200 Index proved a structural advantage in that environment. Market heavyweights BHP and Woodside Energy both delivered solid returns in the quarter and helped buoy the Australian market overall.
With the Australian dollar strengthening around +3.5% against the New Zealand dollar, reported returns to New Zealand investors were around +1.9% for the quarter.
Source: S&P/ASX 200 Index (Total Return)
International fixed interest
Global bond markets experienced a volatile and broadly negative quarter, as the inflation shock driven by higher energy prices prompted a rapid repricing of central bank policy expectations across major economies. The shorter-duration FTSE World Government Bond Index 1-5 Years slightly outperformed the broader Bloomberg Global Aggregate Bond Index over the quarter, reflecting its lower sensitivity to the rise in longer-dated bond yields.
US Treasuries provided relative stability within the global fixed income universe. The US position as a net energy exporter helped insulate it from the most acute inflationary impulse of the commodity price spike. With the Federal Open Market Committee holding interest rates unchanged at its March meeting and maintaining its baseline projection of a single cut during 2026, the US policy outlook remained comparatively well anchored relative to peers. The 10-year Treasury yield ended the quarter at 4.31%, which was +0.16% above its level at the start of the year.
UK Gilts were the weakest major sovereign bond market for the quarter. Prior to the conflict, Gilts had been the top-performing sovereign market globally, with improving domestic inflation data fuelling expectations for future Bank of England rate cuts. The energy shock reversed this dynamic abruptly, as the UK's relatively high dependence on natural gas left it particularly exposed to the commodity price surge. The Bank of England held its policy rate at 3.75% at its March meeting but adopted a decisively hawkish tone, implying a likely bias toward future tightening. UK 10-year Gilt yields closed the quarter at 4.88%, this was +0.40% higher than at the start of the year.
European sovereign bonds also weakened over the period, as the European Central Bank left interest rates unchanged at its March meeting but strongly indicated that rate increases are a realistic outcome, as updated projections pointed to materially higher headline inflation in the second quarter of 2026.
Japanese Government Bonds recorded losses as longer-dated securities sold off ahead of the February snap election, with investors anticipating a looser fiscal stance from the returning LDP administration. The Bank of Japan indicated at its March meeting that it remains more attentive to upside inflation risks than to the downside growth implications of the external energy shock, leaving interest rate increases a credible possibility.
Source: FTSE World Government Bond Index 1-5 Years (hedged to NZD), Bloomberg Global Aggregate Bond Index, hedged to NZD
- FTSE World Government Bond Index 1-5 Years, hedged to NZD
- Bloomberg Global Aggregate Bond Index, hedged to NZD
New Zealand fixed interest
New Zealand investment-grade corporate bonds delivered a modestly negative return for the quarter, consistent with the pattern of rising yields and widening credit spreads observed across global fixed income markets. The RBNZ held the Official Cash Rate at 2.25% at its February 2026 review, offering no new directional impetus for domestic interest rates.
The New Zealand 10-year Government Bond yield closed the quarter at 4.76%, +0.23% above its level at the start of the year. This was in line with the broad international trend of upward yield pressure as inflation expectations were revised higher in response to the global energy shock.
Corporate bonds underperformed domestic government bonds over the period as credit spreads widened in line with global patterns, reflecting the elevated risk aversion that characterised the latter part of the quarter.
The S&P/NZX A-Grade Corporate Bond Index fell -0.5% for the quarter, while the longer duration but higher quality S&P/NZX NZ Government Bond Index declined by -0.6%.
Source: S&P/NZX A-Grade Corporate Bond Index
Asset class returns to 31 March 2026
| Asset class | Index name | 3 months | 1 year | 3 years | 5 years | 10 years |
|---|---|---|---|---|---|---|
| International shares | MSCI World ex Australia Index (net div., hedged to NZD) | -3.7% | 16.9% | 16.6% | 10.4% | 12.0% |
| International shares | MSCI World ex Australia Index (net div.) | -3.5% | 17.4% | 20.2% | 14.7% | 14.0% |
| Emerging markets shares | MSCI Emerging Markets Index (gross div.) | 0.0% | 28.0% | 18.1% | 7.8% | 9.8% |
| New Zealand shares | S&P/NZX 50 Index (gross with imputation credits) | -4.5% | 6.0% | 3.6% | 1.3% | 7.6% |
| Australian shares | S&P/ASX 200 Index (total return) | 1.9% | 21.8% | 13.9% | 10.8% | 10.3% |
| International fixed interest | FTSE World Government Bond Index 1-5 years (hedged to NZD) | -0.2% | 2.4% | 3.7% | 1.5% | 1.9% |
| International fixed interest | Bloomberg Global Aggregate Bond Index (NZD hedged) | -0.6% | 2.0% | 3.3% | 0.3% | 1.9% |
| New Zealand fixed interest | S&P/NZX A-Grade Corporate Bond Index | -0.5% | 3.9% | 5.5% | 2.2% | 3.1% |
| New Zealand cash | New Zealand One-Month Bank Bill Yields Index | 0.6% | 2.9% | 4.5% | 3.5% | 2.5% |
Unless otherwise specified, all returns are expressed in NZD. We assume Australian shares and emerging markets shares are invested on an unhedged basis, and therefore reported returns from these asset classes are susceptible to movement in the value of the NZD. Index returns are before all costs and tax. Returns are annualised for time periods greater than one year.
The case for a strategic allocation to New Zealand shares
A tale of two decades
New Zealand shares have experienced both strong and challenging periods over the past decade and a half.
From around 2011 through to 2020, New Zealand was one of the stronger performing share markets in the developed world. Investors with meaningful allocations to local companies were well rewarded and portfolios with higher exposure to New Zealand shares compared favourably to more globally diversified portfolios.
More recently, that has changed. In the last few years, New Zealand has moved closer to the bottom of the developed market performance tables, while most offshore markets have surged ahead. The shift has been noticeable and, for some investors, uncomfortable.
That discomfort is understandable. It is natural to feel confident in an allocation when it's performing well, and to question it when it's not. But it's also where perspective matters most. Both reactions are versions of the same instinct: judging long term decisions through the lens of recent performance.

Why the strategic case remains strong
Despite recent underperformance, the case for maintaining a meaningful allocation to New Zealand shares remains intact for local investors.
The main reasons for this are:
- Tax efficiency
New Zealand's tax settings tend to favour domestic shareholdings relative to some offshore investments. For many investors, this means that a dollar of return from local companies may be more tax-efficient than the same return from certain overseas holdings. Over time, those differences in tax treatment can compound into material differences in after-tax outcomes. - Currency alignment
Investors planning to retire in New Zealand will have the bulk of their future spending needs in New Zealand dollars. Holding local shares helps align investment assets with these future spending needs, rather than relying on currency movements to work in your favour. It can also reduce the noise that exchange rate swings can introduce into portfolio valuations. - Regulatory and geopolitical stability
New Zealand is not immune to shocks, but it offers a relatively stable legal, regulatory and political environment. In a world where conflict and instability periodically dominate headlines, there is value in owning businesses based in a familiar jurisdiction supported by clear rules and investor protections.
These factors don't guarantee that New Zealand will outperform in any period. What they do provide is a strong foundation for why local shares continue to play a role within a well-diversified portfolio.
Timing versus strategy in turbulent times
The recent performance of New Zealand's share market highlights how difficult timing decisions really are.
When local shares were performing strongly, increasing exposure may have felt justified. As performance has softened, it's just as easy to question that allocation and cut back or consider abandoning local shares altogether.
Both responses are examples of normal human nature. Unfortunately, both also rely on something that is almost impossible to do consistently; correctly identifying which markets will lead, and when that leadership will change.
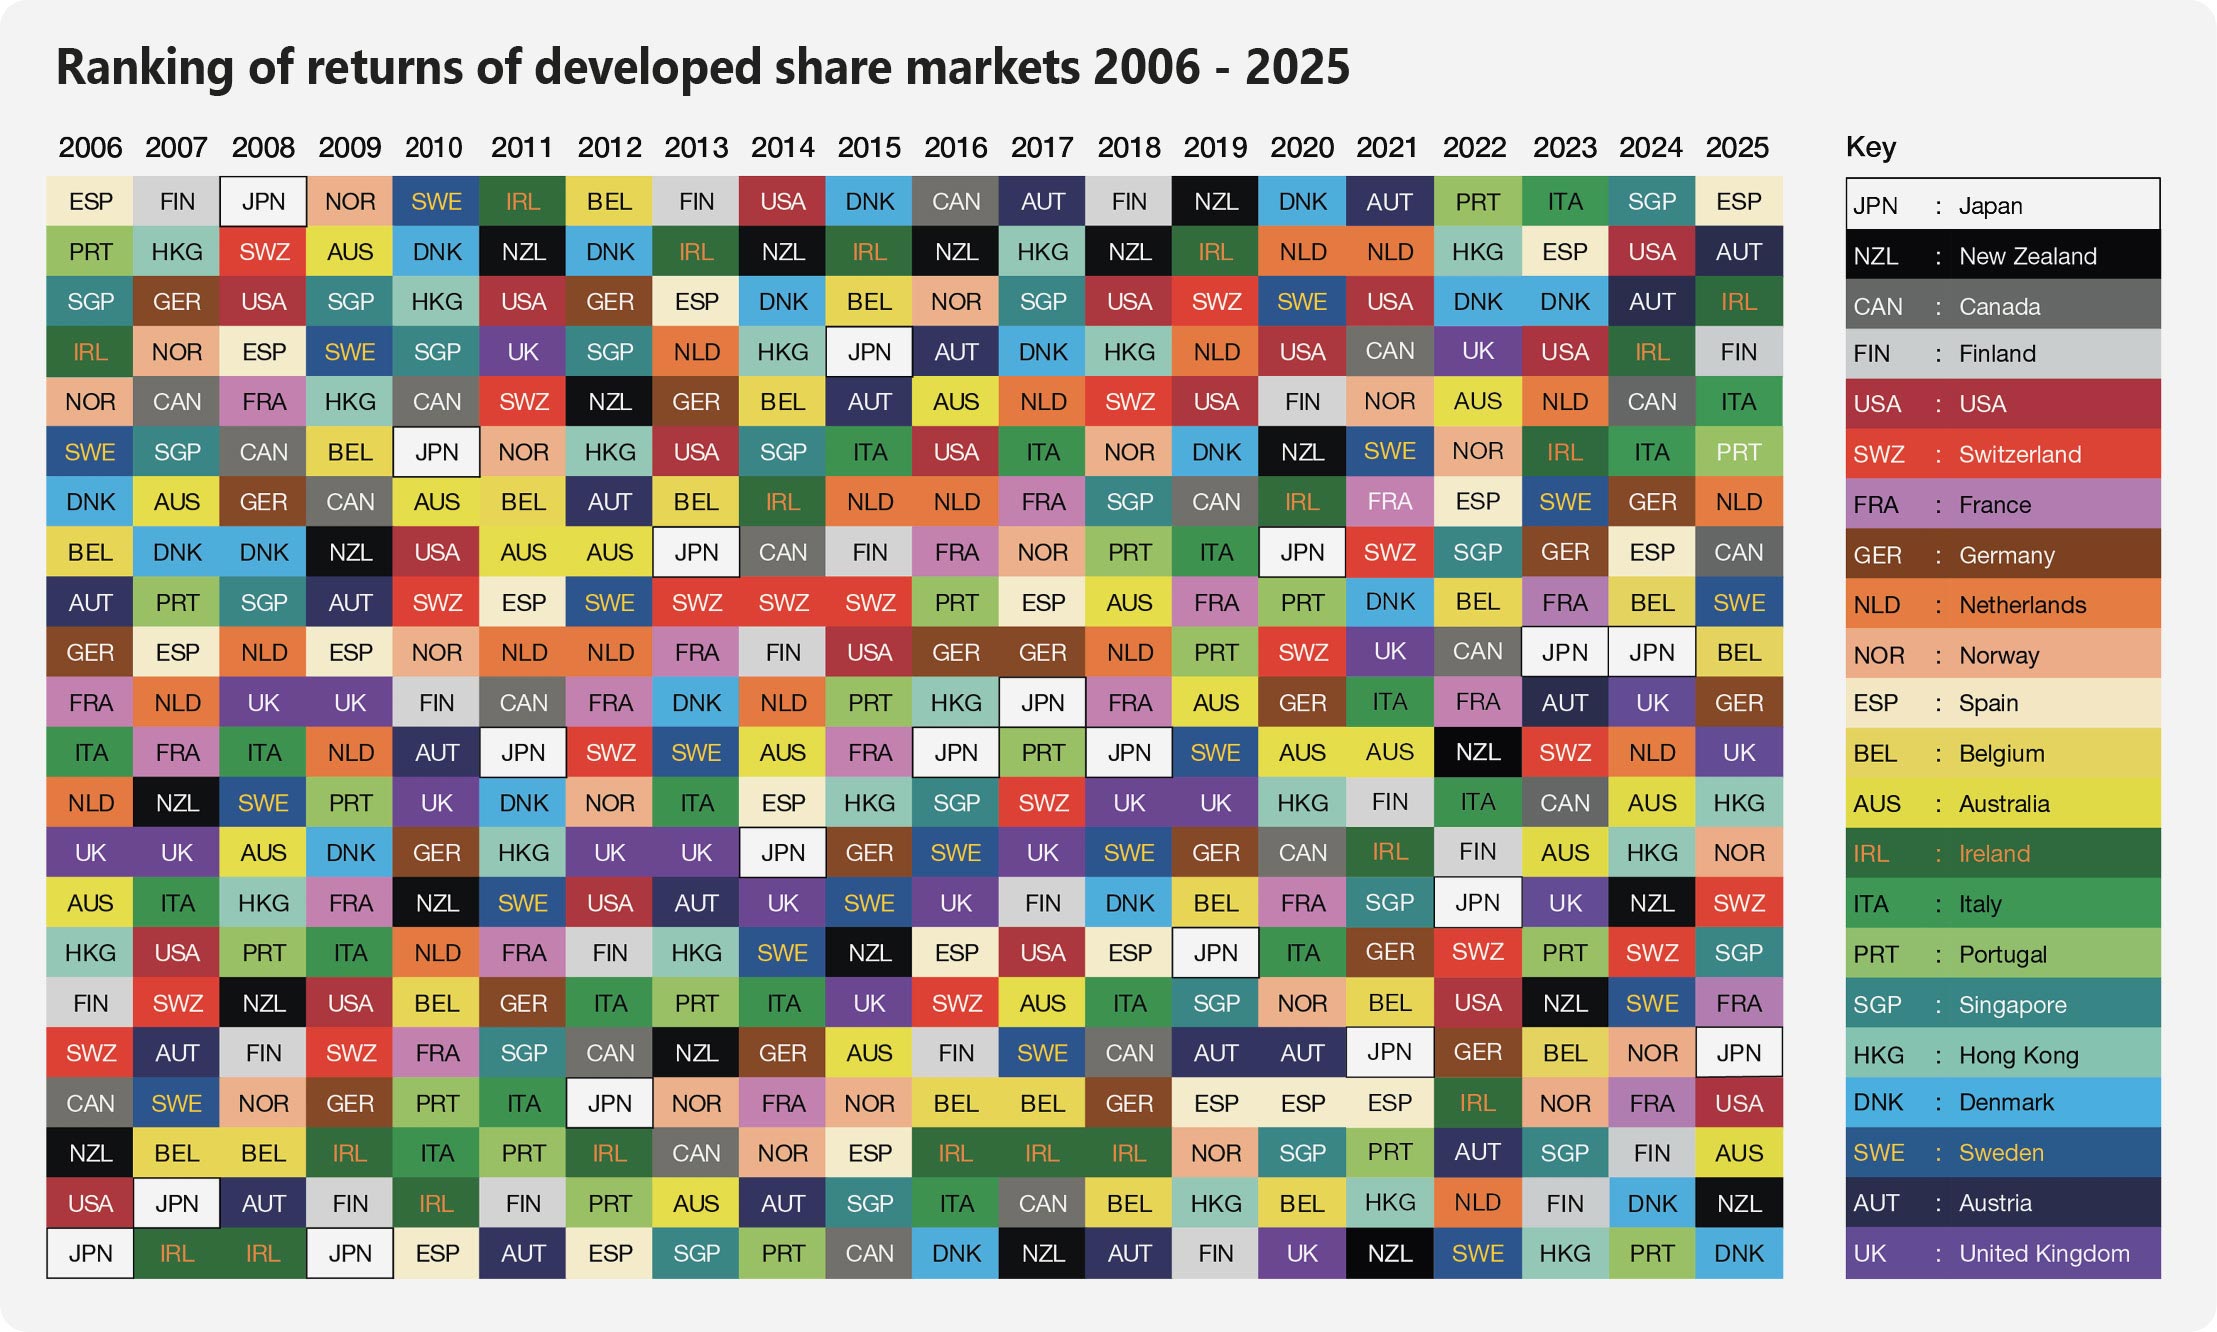
The following chart highlights the return ranking of 22 developed share markets from 2026 (with the highest performing market each year at the top).
Ranking of returns of developed share markets 2006 - 2025
See larger version of this image
In NZ dollars. SOURCE: MSCI country indices (net dividends) for each country listed. Does not include Israel, which MSCI classified as an emerging market prior to May 2010. MSCI data©2025 MSCI Inc. All rights reserved. Past performance is no guarantee of future results. Indices are not available for direct investment; therefore performance does not reflect the expenses associated with the management of an actual portfolio.
The lack of a discernible pattern in these rankings should highlight the obvious challenge in identifying (ahead of time) when countries are likely to move up or down in the rankings. That's the real issue from an active allocation perspective, because to make a successful market timing decision, you need to be right twice: when to move in, and when to move out.
The current global backdrop makes this even trickier. Geopolitical tensions in regions such as the Middle East and Eastern Europe, ongoing uncertainty around trade and security arrangements, and rapid changes in interest rate expectations all influence markets in ways that are difficult to predict. Prices adjust quickly as new information comes in, often before investors have time to react.
A strategic asset allocation approach provides more stable footing. It accepts that markets move in cycles, sets a long-term allocation based on an investor's goals and risk profile and rebalances when markets move rather than chasing recent performance.
Through this lens, New Zealand's performance moving from 'leader' to 'laggard' is not a signal to abandon local shares. It's a reminder that relative performance can turn around relatively quickly, and why reacting to short-term movements can risk undermining long-term outcomes.
Looking forward
So where does this leave New Zealand investors today?
Recent local share market underperformance does not change the role local shares can play in a well-constructed portfolio. For investors whose lives and spending are centred in New Zealand, they continue to offer tax efficient, currency aligned exposure to businesses they know.
At the same time, strong performance in global markets highlights the importance of diversification. Different markets lead at different times and a well-balanced portfolio is designed to benefit from that rotation without needing to predict it.
The real value lies in having a clear framework and sticking to it through both the comfortable and uncomfortable periods. That means:
- Setting a long term allocation between New Zealand and global shares.
- Understanding the role each part plays within the portfolio (tax, currency, diversification, growth).
- Rebalancing portfolios periodically, rather than reacting to headlines.
For many investors, separating noise from signal is not easy, especially when news stories or media commentary may place New Zealand in an unflattering light. This is where good advice and a well explained portfolio strategy are crucial.
Gillies McIndoe Research Institute

The Gillies McIndoe Research Institute is excited to announce a recent collaboration with Hip Hop Science (@HipHopScience on Instagram), led by internationally recognised science influencer and book author, Maynard Okereke.
With a large and rapidly growing global following, Hip Hop Science is known for making complex science engaging, accessible, and relevant to everyday audiences. This collaboration provides a unique opportunity to showcase the work of our Institute to a much broader community.
During his visit, Maynard sat down with our PhD students to unpack some surprising and often misunderstood health topics. For example: did you know not all birthmarks are the same, and some, like Infantile haemangioma (Strawberry Birthmarks), are actually benign tumours? Or that many people have never even heard of one of the most common brain tumours, Meningioma? Alongside this, discussions explored improving treatments for Keloid (raised, overgrown scars), tackling aggressive cancers like Glioblastoma and a powerful interview with a patient who lives with Glioblastoma. These conversations break down complex science into stories that are relatable, eye-opening, and easy to understand.
By combining credible science communication with authentic voices, this collaboration brings our research to life in a way that is both engaging and accessible.
Don't miss this opportunity to see these conversations! Follow along and watch the story unfold on our social media:
Our charity: Gillies McIndoe Research Institute
The Gillies McIndoe Research Institute is investigating new treatment options for patients with brain cancer, vascular birthmarks, and keloid scars. Help us to help them continue this vital work to make effective, affordable treatment a reality for patients who need it most.
Aotearoa New Zealand Festival of the Arts
The 70th anniversary of Aotearoa's most prestigious contest for young opera singers returns to Te Whanganui-a-Tara for 2026. In honour of this huge legacy the Song Quest is now known as the Kiri Te Kanawa Song Quest, thanks to their new Principal Naming Rights Partner the Kiri Te Kanawa Foundation! Make sure not to miss this highly anticipated event and discover the voices of tomorrow.
The Song Quest continues into 2026 with an incredible succession of operatic talent from past winners and contestants. With its generous prizes, the Song Quest propelled careers of opera singers across Aotearoa and into the wider world. The star-studded list of past winners includes Dame Malvina Major, Christopher Doig, Teddy Tahu Rhodes, Madeleine Pierard, Amitai Pati, Filipe Manu, and of course Dame Kiri Te Kanawa herself. This year, the Kiri Te Kanawa Song Quest offers $95,500 in prizes for professional development purposes to support success.
Semi-Finalists will be announced on Tuesday 28 April, and the Semi-Finals will take place on Saturday 4 & Sunday 5 July.
The Kiri Te Kanawa Song Quest Grand Final Gala takes place on Saturday 11 July at the Michael Fowler Centre.
Enjoy a spectacular night out with friends or family and be witness to upcoming Opera stardom! Tickets for the Grand Final Gala go on sale Tuesday 5 May.

Kiri Te Kanawa and 2024 Lexus Song Quest winner Katie Trigg. Photo credit: Hagen Hopkins
Our arts charity: Aotearoa New Zealand Festival of the Arts
We are proud to be the inaugural Patron Partner of the Aotearoa New Zealand Festival of the Arts. Our hope is through philanthropy to have an impact on the arts and for our clients to experience well-being through the awe and wonder of culture and creativity spanning all art forms. Find out more about our Patron Partnership.
Like what you've read?
Please feel free to pass this update on to friends and colleagues who may enjoy it...
If you would like to talk about anything discussed in these articles further, please feel free to call or email.
Phone: +64 4 499 6979
Email: info@bloomsbury.co.nz
Disclaimer
This document has been provided for general information purposes only.
The information in this brochure does not constitute personalised financial advice for any person nor does it constitute advice of a legal, tax, accounting or other nature to any persons. Recipients should seek professional advice before taking any action.
This brochure is based on information obtained from sources believed to be reliable and accurate at the time of preparation, but its accuracy and completeness is not guaranteed.
Any information, analysis or views contained herein reflect our opinion at the date of publication and are subject to change without notice.
None of Bloomsbury Associates Limited ("BAL"), its directors, officers, employees, agents or associates accept any liability whatsoever for any errors or omissions; or for any direct or indirect loss or damage of any kind arising out of the use of, or reliance on, the information provided in this brochure.
Past performance is not indicative of future results, and no representation or warranty, express or implied, is made regarding future performance. Investments are volatile and may fluctuate in that values can go down as well as up and investors may get back less than originally invested.
None of BAL, its directors, officers, employees, agents, associates or any other person guarantees the securities referred to in this brochure or the performance of those securities.
BAL, its directors, officers, employees, agents and associates may hold securities mentioned in this brochure (or related securities) as principal for their own account.
This brochure may only be distributed to investors in New Zealand and other jurisdictions to whom, under relevant law, this brochure may be lawfully distributed.
Bloomsbury Associates is a CEFEX certified firm